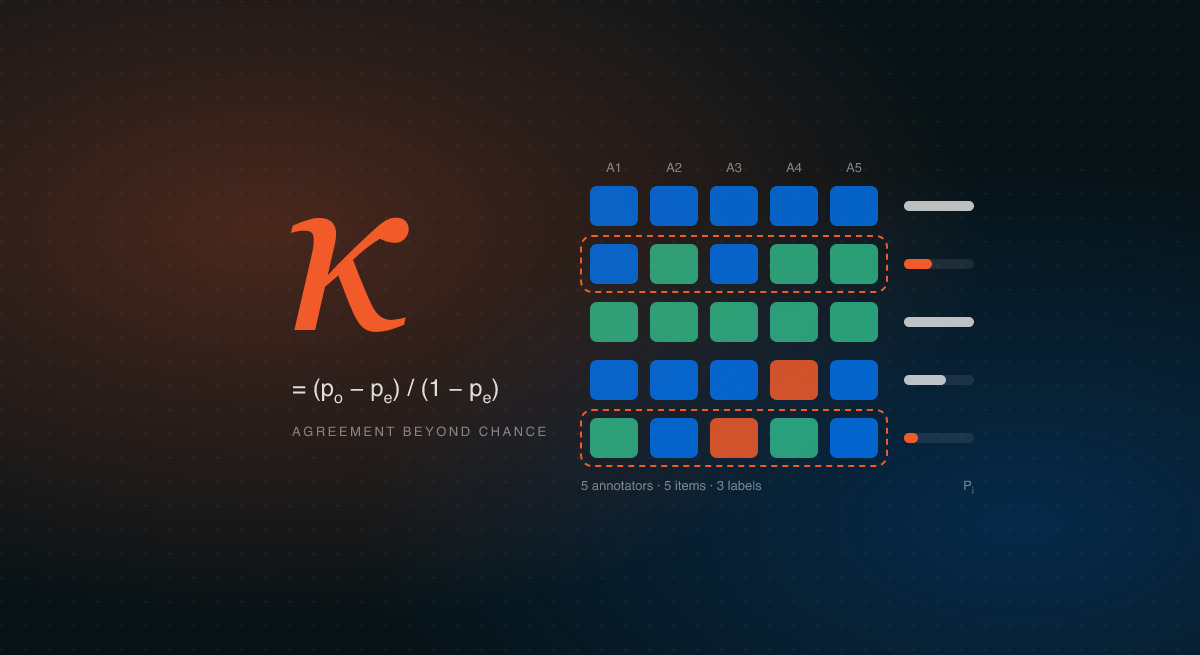
Every model inherits the judgment of the people who labeled its training data. When two annotators look at the same Yoruba tweet, the same Hausa voice note, or the same scanned loan document and assign different labels, the model learns from that inconsistency just as faithfully as it learns from the signal. That makes the question "how much do our annotators actually agree?" one of the most important quality checks in any AI project.
The standard answer is inter-annotator agreement (IAA): a family of metrics that quantify how consistently different people apply the same labeling scheme. The two most widely used are Cohen's kappa, for pairs of annotators, and Fleiss' kappa, for three or more. Both are simple to compute, and both are routinely misread.
This guide walks through what each metric measures, with worked examples you can check by hand, how to interpret the scores without fooling yourself, and a question that sits squarely in data ethics: what should you do when annotators disagree for good reasons?
Why Raw Percent Agreement Misleads
The simplest measure of agreement is the share of items on which annotators chose the same label. It's intuitive and easy to explain to stakeholders. It's also inflated by chance.
Imagine two annotators labeling social media posts as hateful or not hateful, where the overwhelming majority of posts are benign. Two annotators who both default to "not hateful" whenever they're unsure will agree on almost everything without carefully reading anything. Their percent agreement looks excellent, and it tells you almost nothing about whether they can recognize the hateful posts, which are the only ones the model really needs to learn.
Chance-corrected metrics fix this by asking a better question: how much better than chance did the annotators do?
Cohen's Kappa: Two Annotators, Corrected for Chance
Cohen's kappa (Cohen, 1960) compares the agreement you observed with the agreement you'd expect if each annotator had assigned labels at random, but at their own usual rates.
- po is the observed agreement, the proportion of items both annotators labeled identically.
- pe is the expected chance agreement. For each label, multiply the proportion of items annotator A gave that label by the proportion annotator B gave it, then add those products across labels.
A kappa of 1 means perfect agreement. A kappa of 0 means the annotators agreed no more often than chance would predict. Negative values mean they agreed less often than chance, which usually signals a misunderstood guideline or a flipped label.
Worked example: sentiment on 100 Nigerian Pidgin posts
Two annotators label 100 posts as positive or negative:
| B: Positive | B: Negative | A total | |
|---|---|---|---|
| A: Positive | 45 | 10 | 55 |
| A: Negative | 15 | 30 | 45 |
| B total | 60 | 40 | 100 |
- Observed agreement: po = (45 + 30) / 100 = 0.75
- Chance agreement: pe = (0.55 × 0.60) + (0.45 × 0.40) = 0.33 + 0.18 = 0.51
- Kappa: κ = (0.75 − 0.51) / (1 − 0.51) = 0.24 / 0.49 ≈ 0.49
Seventy-five percent agreement sounds respectable. Once chance is removed, the annotators captured only about half of the agreement that was actually available to them. That's the gap kappa exists to expose.
Fleiss' Kappa: Three or More Annotators
Most production annotation doesn't use a fixed pair of annotators. You might have three people label each item, drawn from a pool of twenty. Fleiss' kappa (Fleiss, 1971) handles this. It requires every item to receive the same number of labels, but it doesn't require the same people to label every item.
The logic mirrors Cohen's kappa. For each item, you measure how many of the possible annotator pairs agree (Pi), then average across items (P̄). Chance agreement (P̄e) comes from the overall share of labels that went to each category, squared and summed.
Here n is the number of annotators per item and nij is the number who assigned item i to category j.
Worked example: three annotators, five posts, toxic or not
| Post | Toxic | Not toxic | Pi |
|---|---|---|---|
| 1 | 3 | 0 | 1.00 |
| 2 | 2 | 1 | 0.33 |
| 3 | 0 | 3 | 1.00 |
| 4 | 1 | 2 | 0.33 |
| 5 | 0 | 3 | 1.00 |
- Mean observed agreement: P̄ = (1 + 0.33 + 1 + 0.33 + 1) / 5 ≈ 0.733
- Label shares: toxic = 6 / 15 = 0.40, not toxic = 9 / 15 = 0.60
- Chance agreement: P̄e = 0.40² + 0.60² = 0.52
- Kappa: κ = (0.733 − 0.52) / (1 − 0.52) ≈ 0.44
One technical note: Fleiss' kappa is strictly a generalization of Scott's pi, not of Cohen's kappa. On the same two-annotator data the two statistics will be close, but not identical, so don't compare a Cohen's score from one project with a Fleiss' score from another as if they were the same measurement.
How to Read a Kappa Score Honestly
The most widely cited interpretation scale comes from Landis and Koch (1977):
| Kappa | Landis & Koch label |
|---|---|
| Below 0.00 | Poor |
| 0.00 – 0.20 | Slight |
| 0.21 – 0.40 | Fair |
| 0.41 – 0.60 | Moderate |
| 0.61 – 0.80 | Substantial |
| 0.81 – 1.00 | Almost perfect |
Treat this as a rough guide, not a standard. Landis and Koch described their bands as arbitrary, and McHugh (2012), writing for clinical research, argues for a much stricter reading in which anything below about 0.60 signals inadequate agreement. Four caveats matter more than the band a score falls into:
- Skewed labels depress kappa. This is the "kappa paradox" (Feinstein & Cicchetti, 1990). If both annotators label 93 of 100 posts "not hateful", agree on 88 of those, and agree on only 2 of the hateful ones, raw agreement is 90%, but kappa is roughly 0.23. Always report the label distribution and per-class agreement alongside the headline number.
- More categories, lower kappa. A ten-way emotion taxonomy won't reach the kappa of a binary relevance task, even with identical annotator skill. Compare scores only across tasks with similar label schemes.
- Kappa ignores degrees of disagreement. Confusing "very positive" with "positive" counts the same as confusing it with "very negative". For ordinal scales, use weighted kappa or Krippendorff's alpha, which also handles missing labels. Krippendorff recommends α ≥ 0.800 for reliable data and treats 0.667 as the floor for tentative conclusions.
- Thresholds belong to the task. Document classification with clear categories should clear 0.80. Sarcasm, offensiveness, or sentiment in code-switched text will score lower even with expert annotators, because the items themselves are genuinely ambiguous.
The Ethics Question: When Disagreement Is the Data
Here's where quality metrics become an ethics issue. The standard workflow treats every disagreement as noise: compute kappa, retrain annotators until it rises, then resolve the remaining conflicts by majority vote and ship one "gold" label per item. That works for questions with a single right answer. Is this document a passport or a driver's licence? Is this field a date of birth?
It breaks down on the tasks where African AI matters most. Whether a Pidgin phrase is playful banter or an insult, whether a Hausa post about a religious festival is devotional or inflammatory, or whether a joke about an ethnic group crosses a line often depends on who is reading it. Annotators from Lagos, Kano, and Enugu can each apply the guidelines carefully and still reach different, defensible answers.
A low kappa on a subjective task doesn't always mean your annotators are wrong. Sometimes it means your label scheme is pretending a contested question has one answer.
When that happens, the usual fixes can quietly cause harm:
- Majority vote erases minority readings. If two annotators from one community outvote a third from another, the model learns the majority's view of what is offensive. Across a whole dataset, that encodes one group's norms as ground truth, which is exactly the kind of bias ethical data sourcing is meant to prevent.
- Paying for agreement buys conformity. If annotators are ranked, paid, or removed based on how often they match their peers, they learn to guess the popular answer instead of reporting what they see. Your kappa rises, and your data gets worse.
- Homogeneous pools inflate scores. A team drawn from a single city, language background, or age group will agree more, and that high kappa hides the perspectives your users actually hold.
None of this means abandoning agreement metrics. It means using them diagnostically. Low agreement is a prompt to ask why. Is the guideline unclear? Is an annotator struggling? Or is the item genuinely contested? Each answer calls for a different response.
A Practical IAA Playbook
Here's how we recommend building agreement measurement into an annotation program:
- Double-label a representative overlap set. Route 10–20% of items to multiple annotators throughout the project, not just at kick-off, so drift shows up as it happens.
- Pick the metric that fits the design. Use Cohen's kappa for fixed pairs, Fleiss' kappa for three or more annotators per item, and Krippendorff's alpha for ordinal scales or incomplete overlap.
- Report per class, not just overall. A strong average can hide near-zero agreement on the rare class the model most needs to learn.
- Triage disagreements before resolving them. Sort each one into guideline gap, annotator error, or genuine ambiguity. Fix the first by tightening the annotation guidelines, the second through coaching, and keep the third.
- Preserve label distributions where they carry meaning. For subjective tasks, store every annotator's label, not just the adjudicated one, so model teams can train on soft labels or evaluate against the spread of human judgment.
- Diversify the annotator pool deliberately. Recruit across the regions, languages, and communities your users come from, and break agreement down by those groups to see whose readings diverge.
- Set thresholds during the pilot. Use a structured annotation pilot to learn what agreement is achievable for your specific task before you commit to a production SLA.
- Keep agreement out of pay formulas. Measure annotator quality against expert-adjudicated gold items, not against peer consensus.
How DataLens Africa Measures Annotation Quality
At DataLens Africa, agreement metrics are built into every data annotation engagement from the pilot onward. We report chance-corrected agreement per class and per annotator cohort, triage disagreements with domain-expert adjudicators, and preserve multi-annotator label distributions for subjective tasks, so our clients get data that is both consistent and representative of the communities their products serve.
Our annotators span 16+ African countries and dozens of languages. That diversity is what lets us tell the difference between a noisy label and a real difference in perspective.
Want quality metrics you can actually trust? Talk to DataLens Africa about designing an annotation pipeline with agreement measurement built in from day one.